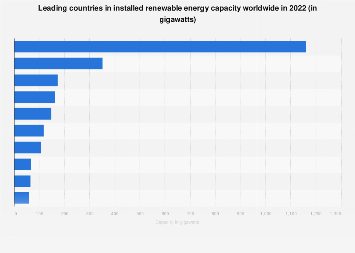
Can’t wait for the libs to say: “bUt cHInA Is THe BigGEsT PolLUteR”. Not acknowledging this and the fact that most stuff is made over there.
The funny part is that despite the fact that the west outsources a bunch of its production to China, per capita emissions in China are still lower than most western countries.
China should be the biggest polluter anyway, it’s the biggest country.
Tied with India but India is much less industrialized.
ELEVEN HUNDRED SIXTY-ONE GIGAWATTS, MARTY!
Yes, and no.
As a Canadian, I’ll shamelessly plug the Canadian numbers for a minute.
- Canada has a population of 38.25 million. (Or ~1/35th the population of China)
- The US has 332 million (or a little more than 1/6th the population of China)
If we do per capita, Canada leads those 3 in renewable energy generated, at:
- Canada: 2.77MW/person
- US: 1.06MW/person
- China: 0.8MW/person.
I didn’t do the other countries, so there’s possibly a higher country.
Canada is literally the worst out of all G7 countries in terms of per capita emissions https://www.theglobeandmail.com/politics/article-contradictory-spending-slow-pace-trouble-trudeau-governments-emissions/
True, but I wanted to highlight that China isn’t “far ahead” of the pack, like the post suggested.
In terms of scale and absolute number they absolutely are though. Canada might produce more renewable energy per capita, but that’s more than offset by the sheer gluttony of energy consumption per capita. Also worth noting that much of Canadian renewable infrastructure, such as solar panels, was almost certainly produced in China.
No, that’s the point. In terms of scale, they are literally behind on this one factor.
** Edit to add: you have very valid points on the Canadians over-consuming
In terms of scale China absolutely dwarfs the entire west. There’s no comparison here.
Perhaps I’m misunderstanding what you mean by “in terms of scale”. Typically, that’s what we use “per capita” for, no?
I mean absolute scale in terms of total power production and size of deployment.
…and without making it compareable to other countries by “per capita” or “share of renewable in total energy production” the numbers mean nothing at all.
Yes, they do shitton and yes they grow like mad in this field. But dont make yourself attackable by being sloppy with your arguments. Dont need to bend the numbers to make them look good.
I’m not being sloppy with my arguments at all. Here are the numbers for you to chew on:

Nov 28 (Reuters) - China is leading the global renewables market and is on track to reach a record-breaking 230 gigawatts (GW) of wind and solar installations this year, consultancy Wood Mackenzie said on Tuesday.
China’s estimated installation is more than double the number of U.S. and Europe installations combined, Woodmac said in a report.
China’s wind and solar project investment is expected to reach $140 billion for 2023, the report added.
"While some other markets are moderating renewables targets, China has pushed up its 2025 wind and solar outlook by 43% or 380 GW in just a couple of years,” said Alex Whitworth, vice president of power and renewables research at Wood Mackenzie.
The country’s share of coal in power generation has been continuously falling and about 80% of the reduction was replaced by renewables and the rest mostly by nuclear power, he added.
China’s energy bureau said last week that total installed solar power capacity hit 536 (GW) in October, up 47% from a year earlier, with wind capacity also rising 15.6% to 404 GW.
Earlier this month, Wood Mackenzie said China will have more than 80% of the world’s solar manufacturing capacity through 2026 and will be capable of satisfying annual global demand for much of the next decade.
Finally, emissions in China have now entered structural decline.
I’m not really sure how I feel about hydroelectric being classified as renewable. On one hand it doesn’t emit but when you look at projects like the James Bay plant, it’s hard to ignore the massive amount of emissions that went into creating the infrastructure and the permanent impact on the landscape.
I’d suppose this is kind of off-topic and is more of a question of how renewable hydroelectric power generation is on a project by project basis based on environmental and ecosystem impact.
Edit: forgot to mention, the impact on indigenous lands as well in many of the colonized countries.
I’ve been reading the whole debate with Yog and Grain and I just want to say I generally agree with you on that point. Maybe it’s the debate bro in me but it feels hypocritical that we always bring up the per capita ratio except when it looks good.
But overall, the biggest China W is when compared to a comparable capitalist country: India. That’s the proof of socialism’s superiority
The graph is about energy capacity, for energy production numbers (found https://www.irena.org/Publications/2023/Jul/Renewable-energy-statistics-2023), Canada actually has around 12.0 MWh/person, as opposed to China’s 1.7 MWh/person.
Just want to point to this annual statistical publication by the IRENA (International Renewable Energy Agency) for more details about the type of renewables by country and numbers over a decade: Renewable energy statistics 2023 https://www.irena.org/Publications/2023/Jul/Renewable-energy-statistics-2023
For example it shows that total renewable energy capacity in
- 2013: Worldwide = 1567 GW, Europe = 419 GW, North America = 273 GW, China = 359 GW
- 2022: Worldwide = 3382 GW, Europe = 706 GW, North America = 491 GW, China = 1161 GW
It also shows energy production of those renewables in GWh for those interested.


